MrSchwen’s Google Forms Assessments
Advanced Features
 *
*Follow me @mrschwen on Twitter
See updates and applications on my blog: mrschwen.blogspot.com
Staff development available.
*All section headings in this document will eventually link to instructional videos.
Course Management System
Click here to get started with directions and relevant links.
Automatic Email Feedback for Students (get copy of script here)
This script is adapted from the Google Apps Script Gallery created by Romain Vialard.
To view his video for integrating the script into a Form, click here. (Although most of his process is automated in the menu I've created now.)


- To enable the script, make sure you have your answer key set and the link shared with your students.
- Click the Assessment Menu and click Activate Email Results.
- *If you copy an assessment that already has the email script activated you will have to turn it off and then back on again for it to work. If your template does not email activated (which it shouldn't) you shouldn't have an issue.
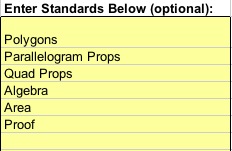
Assigning Standards to Assessment Items (video)
This area integrates with the feedback portion of the Email script. If you would rather embed links to instructional videos or short statements of feedback for the students on each item that is fine it just won’t score students by learning target in the Class, Individual, and Standards tabs.
I use short 1-4 word statements, entered into the yellow “standards” cells on the setup tab. This keeps the graphs cleaner looking.
The statements can be explained in more detail on the student test copy to identify what learning targets still need work.
Once edited in the setup tab, go to the form data tab and select the target for each item in the yellow cells below the correct answer. This should be done prior to the first student taking the assessment.

If you are using learning targets to separate out assessment scores this area can give results by individual and by class.

You will also see a list of missed question numbers for each student in the Individual Student tab. They will get the same list in their email, this is just helpful for me as the teacher when looking at results.

Test Item Statistics and Feedback (video)


Embedding Graphs in a Website (video)

Google Assessments Class and Student Progress Dashboard


After configuring multiple dashboards, see this post for creating a dashboard that will navigate between them all.
For a multiple choice test here you can see the breakdown by answer’s chosen. You can also edit the yellow cells to change what the answer choices were. This will not show results as easily for text answers or varying answer choices on test items.
For all items you will get biserial data results with a calculated feedback statement on the reliability of the test item.
These results will be more accurate as more students take the assessment. If you want to change the biserial ranges you can do this in the table on the right side in the yellow cells.
You can also change the feedback statements but this will affect the color coded statements that show up in the feedback column next to the biserial values.
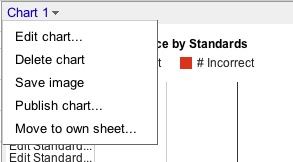
For class communication and data driven instruction I like to embed graphs at times for students and parents to see on the class website. This can be done in any graph in an assessment by clicking on it and from it’s menu choosing “publish chart”. You will be able to choose from an “interactive chart” or an “image”. I’ve been using image since the script for interactive chart does not always display the way I want it to.
Once you have the image html copied, paste it into a web page editor to display to the public. I usually just grab the http address and embed it as an image using the url option in my site editor.
Google Assessments Class and Student Progress Dashboard

Setup the dashboard initially by entering the individual keys for each assessment you want to measure growth. That's it, once populated the dashboard will pull live data as students begin to take the assessments. Based on the growth model most graphs will require at least two tests with data before the graphs begin to be populated.
Once the keys have been entered, the data will start showing up in the dashboard as you make your selections in the yellow validated cells using the drop-down menu's. You may have to be patient as the data loads in the system.
At the top of the dashboard will be links to assessments shown, generated automatically by the keys you entered in on the setup tab.
Get the dashboard template from the gallery in the Google Template Gallery (click here)After configuring multiple dashboards, see this post for creating a dashboard that will navigate between them all.
Custom Grade Data Export Sheet
Click here to view a video demonstrating how to use the grade export sheet.
Click here to view a video demonstrating how to use the grade export sheet.
MrSchwen’s Google Assessments--Advanced Features Updated July 5th, 2011 Andy Schwen
MrSchwen's Google Forms Assessment System by Andy Schwen is licensed under a Creative Commons Attribution-NonCommercial-ShareAlike 3.0 Unported License.Based on a work at mrschwen.blogspot.com.
