Friday, December 2, 2016

Less clutter and more interesting

Today is an end of the trimester work day. On my to-do list I set aside some time to make my classroom less cluttered with stuff kids don't actually look at and to have more creative visual examples of what we actually do in math class. There is also a shout-out to one of my favorite shows, Lost, as a metaphor for our standards based learning cycle.

Wall of sequences
I invited students to participate in this as well. Top 3 most creative sequences from each class will have the opportunity to be put up on the wall as well.


Standards based grading and student reflection visual
We reference these ideas on our assessments and in conversations in class. I wanted a visual in class so I made this. The messages below the pictures are in this slideshow if you can't read them in the picture.


Tuesday, November 29, 2016

Live student agenda


A practice I've been doing this year that I've found really helpful for students is updating a live student agenda that is displayed on the board and shared with students. I use the same Google Presentation for an entire unit and just update the first slide to be the current day agenda. I move old agendas to the bottom of the presentation for reference and use for next year...assuming most things are similar for next year.

I push the agenda out at the beginning of the unit through Google Classroom and encourage kids to bookmark it. It sets up a flow for the day and I try to be as visual with what is displayed as possible. All activities referenced for kids are live links and take away the hassle of what they need to be doing next. I use emojis in class to hint at expectations (teacher led, working as a class, ticket out the door, extension).

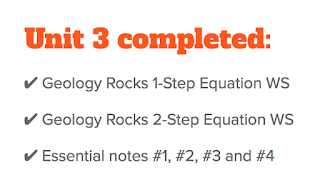
In the slideshow I'm also having slides for essential class notes (in case a student is absent...or didn't write down what I asked them to a few days back) and a rolling list of the main practice activities that should be completed up to this point.

Thursday, November 3, 2016

Google spreadsheet function machine

As an extension, I challenged some students to make a spreadsheet (with formulas) that would write a function for any linear function values they put into their table.
I had a couple of boys excited about the task and it was great to see some of their misconceptions drawn out through the activity.

Misconception #1: Rate of change is always just the difference in output values
Their initial table had x values increasing by 1. When they finally got a working function I congratulated them...and then asked, "What if the x's increased by 2 and didn't start at 1?". I even changed their table values and they realized their function now didn't work in this new situation. Motivated by a new layer of challenge they went back to work.

Misconception #2: Zero term is always the term before the first term in the table
Prior to the experience they thought the zero term (connected to arithmetic sequence concept we'd been doing) was the term before the values represented in the table. For the table above that may have been for them the x = 4 or even x = 3 value rather than thinking of when x = 0.

Being nerdy and excited about spreadsheets myself I completed the challenge as well and made it a fun visual function machine. Here's the link to mine.