Electronic homework and assessment scoring template
Below are some screenshots of a homework and test template I have been working on and sharing with other educators. My goal was to be paperless in the data collection and student feedback process while collecting more data than was possible on my own. Get the templates here.
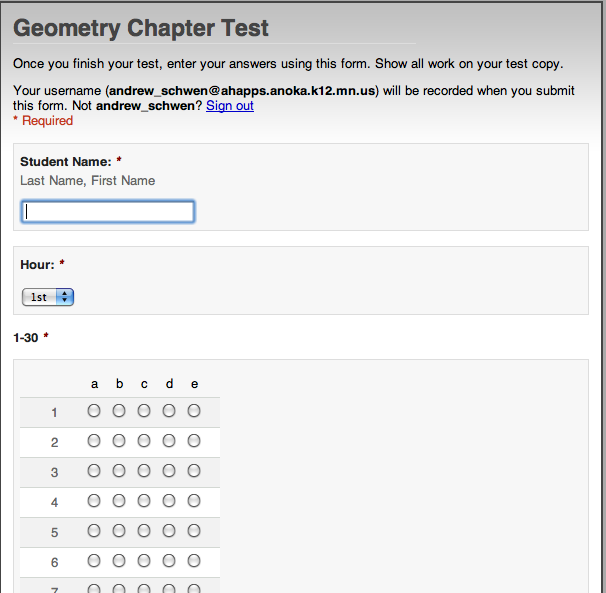
1. Google Form Tests and Homework: Students submit homework and test answers through the online Google Forms application. We are a Google school so all our students have login names, making for a more secure test management system. In this test, all solutions were multiple-choice but it will also accept numerical answers or allow more than one answer to be selected when the need arises
.
2. Color-scoring by student: All submitted data gets filtered into this sheet, which assigns a value of 1 or 0 to each answer. Each incorrect answer, scored as 0, is also highlighted in red for the teacher to be able to quickly see which answers are incorrect for a given student.
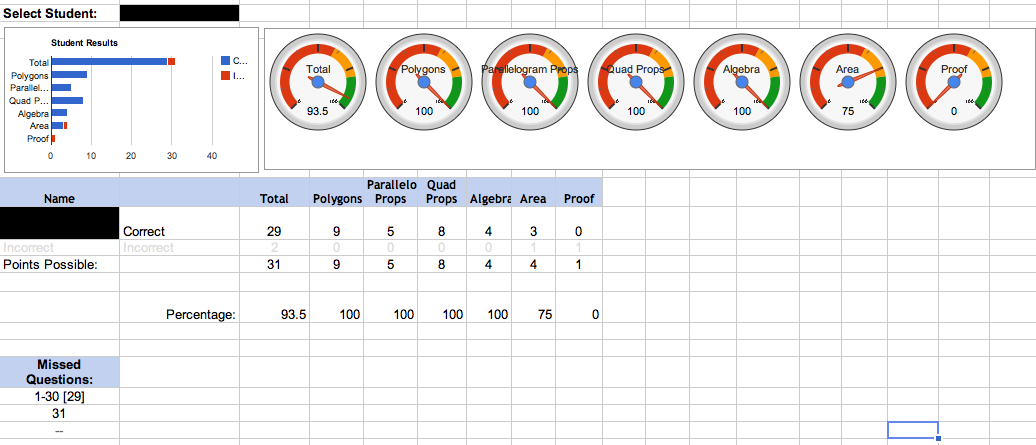
3. Individual Student Results Explorer: In this page any student that has taken the test can be displayed. Information shown here has overall score, scores by standard, along with a list of the problems they had incorrect.
4. Individual Class data: On this sheet, scores are filtered by class. This is helpful for when multiple teachers are giving the test to see how each class compares and the statistics for any given class.
5. Item Analysis: As my collaborative team has been writing our own tests, this page gives valuable feedback on each test question. We can see which questions need better distracter answers and have bi-serial feedback to help analyze which test items may need to be revised. The comments are generated automatically based on the bi-serial values.
6. Results by Assessment Standard: In the past, scoring our tests by standard took a great deal of time. We had to go through and total points for each standard rather than just a total test score. With this system, individual questions are tagged with a standard in a dropdown menu. The scoring filters out scores by category. When a student needs to retake a standard, I am able to pull the results from the original test without having to search through a stack of test papers. This image below shows all students’ test performance by standard to allow us to reflect on the unit of instruction and decide if we need to reteach or supplement more material next time.

No comments:
Post a Comment