Showing posts with label geometry. Show all posts

Tuesday, October 4, 2016

Using @Desmos to generate pythagorean triples


Early stages as far as how I'd use this with students but definitely some fun math to investigate here through Desmos related to generating pythagorean triples in a coordinate grid.
Things I notice:
When gcd(m,n) = 1 we have the primitive pythagorean triple, when gcd(m,n) > 1 we get a triple similar to a primitive triple.
Things I wonder:
How could I get spirals to show up in desmos like those in this wikipedia article?

Friday, March 7, 2014

Triangle Inequality: Introducing a learning target in context

In starting a new unit today I wanted to give context to students for writing inequalities. In our algebra class students have not yet learned the triangle inequality theorem which states that:
The sum of any two sides in a triangle must be greater than the third side.
Seems like a great opportunity for some 'ruler math'. I kept the rulers on my desk until after the bell because spring break starts after today and I know how middle schoolers can we with unstructured time and these tools...

In anticipating the pacing to be different for each student I made  the activity as a Google presentation and provided students the link, instructing them to do their work on paper and answer completely any questions asked of them in the activity--noting that I would be breaking in periodically to the whole class and facilitating some discussion.


My favorite part was #4 of the first drawing where many of them grew frustrated with not being able to construct a 1 cm, 2 cm, 5 cm triangle--thinking it was something they were doing wrong. Kind of a fun way to watch them squirm and I know I'm not the first math teacher to have ever done this.

I had some awesome conversations with students while they were working. One student changed what he said mid-sentence. He went from saying
"The two lengths need to be at least the length of the third...The two lengths need to be more than the third length..." 
I asked him why he changed his wording and he explained the difference between the two correctly. Pretty cool--I made sure to highlight that to the class in our whole group time. This kind of mathematics is so much more fun to teach than the traditional "do this, copy me, don't think" style. I overheard the same student above before leaving say to his neighbor
"Math is my hardest class because you can't just memorize stuff and copy it down. You actually have to understand the concepts to do well." 
I told him I will take that as a compliment.

I am not expecting all students to go here but I am hoping that some make some connections to they pythagorean theorem and how it relates to acute and obtuse triangles in the last slide.

I've already made some revisions to the activity since teaching it one period and I wouldn't be surprised if it changed a little more as the day goes on. As always I'm open to other ideas or revisions to make it a better experience for my students.

Wednesday, December 4, 2013

Polygon angle sum theorem and the distributive property

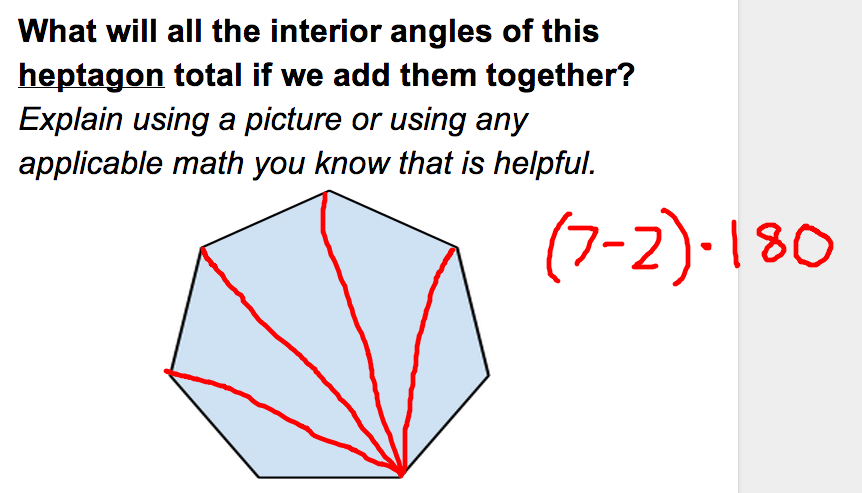
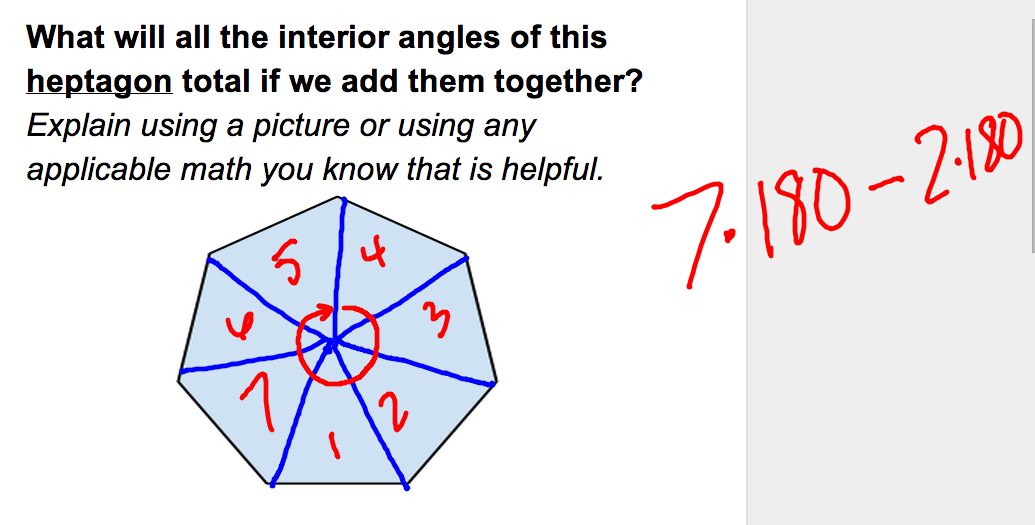
We did this in class today as a warmup activity. I've always led students toward the first example but we made kind of a cool connection to the distributive property when we tried to make a student's picture work when they drew the triangles from the center of the figure instead of from a vertex.

In the first example all angles in the triangle add to the total measure of the polygon.


In the second example, the interior angles for the triangles (center) do not make up any of the polygon interior angles so we subtract them. To make the connection rather than writing it as 360 I wrote it as 2•180.


Tuesday, June 25, 2013

Using coding to think deeply in math #codemaths

What led me here...
I write this in hopes of what the next year will look like for my students in Algebra. I find the more that I learn to write code the more important it is that I pass on this skill to my students. Perhaps with daily access to Chromebooks and Google Apps Scripts in their Google Drive that will look like building extension activities parallel to the algebra we are learning in class that will also teach the code skills to my students.
In writing some of more own programs I feel that I've had to think deeply about the mathematics in order to consider all possible outcomes for anticipating errors or situations that may cause the program to break. Last spring I wrote a web app that will take the coordinates (in order) for a convex polygon and identify it (quadrilateral, parallelogram, square, rectangle, rhombus, kite, trapezoid). I had to anticipate what would happen if slopes calculated in the program would be zero or undefined and how to address that situation for the final output. I didn't have students create an actual program but some did choose to make a Google presentation that, through clicked links, would identify what type of a quadrilateral is present at the end by its properties.
Yesterday, while in a workshop on using code to teach mathematics, I decided to dig deeper into my quadrilateral program.
Researching what I thought might be possible
By doing some searching online here and here I found a 'fun' way to calculate the area of any convex quadrilateral using the slope and distances of its diagonals. This was an exercise where using a trig identify was actually necessary! So here is what I found:
You can calculate the area of a quadrilateral (convex) by taking half of pq sin θ where p and q are the lengths of the diagonals and θ is the angle between them.
This prompted me to ask the next question:
How do I calculate the angle between two lines using  their slopes?
Like any good child of the millennial generation I Googled the question I was asking and found this:
 θ = tan^(-1) [(m2 - m1)/(1 + m1*m2)]
Putting it together as a composite function:
Area = 0.5 pq sin ( tan^(-1) [(m2 - m1)/(1 + m1*m2)] )
Considering the range of circumstances
And now I had to think about what this would mean in the program. I know that there is the possibility of having some vertical lines as diagonals (problematic in a program because of division by zero) and also the possibility that a diagonal may be horizontal. I would need to use some if, else if, and else statements to account for this and figure out what to do in that situation. This is where some discovery for me as a math teacher took place:
In the situation of either a vertical or horizontal diagonal I could think of the quadrilateral being split by it, creating two triangles and finding their area by multiplying the length of the vertical/horizontal diagonal and then the difference in either the x coordinates or y coordinates respectively of the other diagonal (basically the altitudes of the two triangles added together). The horizontal diagonal wasn't really problematic in the program but I thought the connection to the vertical diagonal process was interesting.
In the situation of a vertical and horizontal diagonals this would create perpendicular lines causing θ = 90. Since sin 90 = 1 the area calculation simplifies to 0.5 pq which is the formula we teach in Geometry for areas of kites and rhombus (kind of cool to see how all the area formulas are related by trigonometry for me at this point).
For all other quadrilaterals I can just calculate the slopes and distances of the diagonals and use the standard formula above.
Converting the math to code
 So here is the javascript code for calculating the area of quadrilateral ABCD, for sake of time I'm not going to explain the variables but I'm guessing if you've read this far you can figure it out:
 //////////Area of quadrilateral////////////////////
   if (slopeAC == 0){if(slopeBD =="undefined"){var areaCalc = 0.5*distAC*distBD;}else{var areaCalc = Math.abs(distAC*yDiffBD);}}
  else if (slopeAC == "undefined"){if(slopeBD ==0){var areaCalc = 0.5*distAC*distBD;}else{var areaCalc = Math.abs(distAC*xDiffBD);}}
  else if (slopeBD == "undefined"){var areaCalc = Math.abs(distBD*xDiffAC);}
  else if (slopeBD == 0){var areaCalc = Math.abs(distBD*yDiffAC);} //This condition is not necessary and would be covered in the final else statement but is interesting in how it relates to the previous else if statement
  else
  {
  var theta = Math.atan(Math.abs((slopeAC-slopeBD)/(1+slopeAC*slopeBD)));
  var areaCalc = 0.5*distAC*distBD*Math.sin(theta);
  }  
 So now to think how to lead students toward learning these same skills...

Friday, March 1, 2013

Math arguments today in class

Organic development of definitions
Today felt like one of those lessons that went way better than I could have expected. We used a Venn Diagram comparing two shapes at a time to come up with similarities and differences between all squares, rectangles and rhombus. Of course there were the kids that spouted "a square is always a rectangle but a rectangle is not always a square" but they really had to then think about how that applied in the diagram. This was a good natural stopping point for creating our class definition of these three shapes. The conversations were passionate and on topic and it was fun to see their understanding of these shapes deepen as time went on. To conclude this portion of the lesson I had the circles represent rhombus and rectangles and asked what they had in common, trying to lead the conversation toward 'squares'.


Flow charts and modifications
Next we moved to creating a flow chart, given a parallelogram, that would help us identify each of these three shapes. I had an example set in which they had to name the shape that applied and then we started to mix it up. I gave them a shape and then had them determine the property questions and answers to choose that would get us there. Another modification was to give them the answers (yes then no for example) and they had to determine what questions would lead us to the given shape. Through this my classes were able to determine that having perpendicular diagonals is just another way to identify equilateral parallelograms and congruent diagonals is an alternate way to check for equiangular parallelograms.
Here is a Google Drawing of the final flow chart activity we did.

Introducing programming in math
A secondary reason for the flow chart portion of the lesson was to introduce a programming extension I'm hoping some will choose. Without actually having to do code I want students to create a stack of PowerPoint cards with yes or no questions that will correctly identify any quadrilateral by its properties. I was hoping to hook them with a taste of it in class and give them some familiarity before taking on the bigger challenge. As the year has gone on and in my own personal learning I believe that getting my math students more opportunities to think like programmers will help them learn valuable programming skills and a deeper understanding of the math they are applying within it.


Tuesday, December 4, 2012

Making adjustments and seeing benefits

I have always wrestled in my classroom with doing what is best for kids and learning. Opinion or experimenting sometimes win my favor but in the back of my mind I'm always thinking about what research says is best. That being said I've made some changes in my classroom lately that I think (both by opinion and research) are benefitting my students.

Begin with inquiry where students construct or discover much of what they are learning

In the (recent) past the videos were used to introduce new material and the idea was that we'd go beyond that material when students came to class. The trouble came with when students either didn't watch the videos or worse yet didn't understand them. By introducing the material through video I was also bypassing the opportunity for students to construct their own understanding through inquiry and make meaningful connections.

As a geometry teacher I want my students to understand the hinge theorem because they construct some triangles on paper rather than because they wrote something down what I said in a video--that won't make sense to them and they won't be able to apply it in new situations if they don't understand it.
I'm not throwing out videos, I'm changing the role they play in the learning cycle based on Ramsey Musallam's Explore-Flip-Apply method. Students first explore the concept in our classroom community, after our explore activities are complete they then view video (flip) later on to anchor what they are developing in understanding based on the investigation and then students apply the learned ideas to new situations. This has helped in focusing our class time and giving more meaning for us to scaffold our learning on.

Also during our class time I either begin with a question (often review but not always) or a new seating chart. I take attendance either by missing seats or by who didn't respond to the question. I base the seating chart off of data although the kids don't always know that. Our current seating arrangement places kids who scored better on our last assessment next to those that scored lower.
The intent is to raise the level of conversation for all students as we are doing these community based activities. Students will usually just choose their friends (which they still can on some days) but I want to make sure great math is happening at all groups. 
In some cooperative learning staff development I had years ago we were told never to place the highest achiever next to the lowest achiever (neither would be able to understand each other). With that in consideration, I created a seating chart that relies on recent High, Medium High, Medium Low and Low scores. I have students with highest scores seated next to students with the medium low scores and students with lowest scores positioned next to the medium high scorers and some of each at each table group. I also know which table groups are hot-spots in the room so I make sure to get to those more often as I anticipate they'll have more questions. I generate a chart for each class on a selected assessment and then throw screenshots into a Google presentation so I can access them quickly to either print or use at the start of a class.
For those that use my assessment system you can actually add the seating chart template to your current dashboard by searching and installing my seating chart script that is now available in the script library. It is also included for new users automatically.
My instruction needs to be more focused on learning targets.

I was concerned that by focusing on separate learning targets and objectives students would see the learning as separate modules and not make connections but instead I've been finding the opposite to be true. Because we've been more focused, students have more readily made the connections themselves.
As we begin new ideas, they are grasping them quicker and making connections across ideas that I haven't seen with past years. 
Students begin each unit by looking at a self-assessment rubric written for each specific learning target. They continue to look at the rubric as they are in the learning cycle and write down new dates as they see themselves moving to the next level. Students are taking more ownership in their learning by seeing what it will take to get to a mastery understanding of each learning target.
As a teacher I can anticipate the levels of understanding a student will show as they move through the cycle. This helps them identify their own level using specific indicators in the rubric can help them see where they are in the learning process.
Past practice for me was to just give them the "I can" statement but they didn't really know if they could or couldn't or to what extent. 
In anticipation of some students arriving at mastery sooner than others I'm trying to include a link for many learning targets to an activity that is an extension of the learning. Here's an example of a rubric for an upcoming unit.


No more homework quizzes

I've done away with submitting work answers online for class work that is formative in nature (not for grade). I found students were bypassing learning and just trying to come up with answers. I've been able to attend some staff development by Tim Kanold where he said to give students the solutions to homework for them to work toward in place of students not knowing the answers ahead of time. I have put together class work problems where the expectation focuses more on explaining their understanding and applying of skills from the current learning target and integrated review of targets from the past. 
Solutions are posted online (worked out by me) and also in a printed binder in the classroom and students are encouraged to check these both when they get stuck or when they finish. I said last week: 
"Don't assume that you are awesome and got them all right. You might be awesome, but just double check your solutions before you think that." 
By giving students the solutions they are able to check for their own understanding and I am not spending my time recording more data in my grade book or checking individual homework assignments. I can spend my time as a teacher preparing meaningful activities for what we do while we are together.

Always reflecting on what we do

I believe that I will probably be doing something totally different a year from now or maybe even next month as far as class goes. I will always be looking for methods that will help my students learn math (and life) in more meaningful ways. I believe this is what makes us as teachers better is that constant struggle for how we can be better for our students. If you think there is a better way or I am totally off-base with this approach, please feel free to guide me in the right direction in the comments below. If you just criticize without offering solutions that helps no one.


Monday, October 15, 2012

Use of data to assign peer groups for a class activity

Not that everyday in my class feels like a success, but today I felt like we accomplished something positive. We are moving into a topic I anticipate students to struggle in based on my classroom history. I put together a Google PowerPoint that had two tiers of difficulty to it. On the first slide I put an overview of the problem followed by two links--basic and advanced where student pairs could decide which path to take. They then would complete that portion and move ahead to see my potential/suggested solution--allowing each group to determine their pace. Each group seemed engaged the entire time and the conversations were focused and getting to higher level topics not obvious to the activity itself.
What's more, I had a chance to try out my seating chart creator. Using a recent assessment data point, I made the chart to pair a struggling student with a student demonstrating recent success. My reasoning was to elevate all conversations that would be taking place to bring more students to a higher level of understanding. The seating template, now that I've made it, can also be saved and updated with future data points. I'm also thinking of using a different structure for seating to assign students needing additional help for some more targeted intervention time at the start of some class periods. Beauty of it is students don't know why they are placed where they are but I can work more efficiently in getting to students that need help sooner based on classroom location.
I hope to post a video demo of the seating chart setup in action soon.

Friday, September 21, 2012

Points, Lines and Planes extension menu

Minnesota puzzle

This year I have decided to be more (math) content driven in my own personal learning, mostly inspired by the work Dan Meyer has been sharing on his blog. I have learned a lot in the last couple years about differentiated instruction, personalizing learning and using technology to help my classroom run more efficiently. My focus this year is to take advantage of that efficiency and provide more opportunity for depth and enrichment for my students in my content area.
As a first step in that direction I have created an extension menu for my first unit with my Geometry students. This is not a new idea or a concept I have come up with on my own but I wanted to share it here in wanting to be transparent on how I am wanting to grow as an educator and hopefully stimulate similar growth for others.
As I try to differentiate instruction for students, I often find that no matter what I do, some students will still get through the standard material sooner. Rather than creating a "race to the finish" in class I'm taking a different approach and compacting the curriculum for those students using pretesting and allowing them to work on extending the learning beyond what the majority of the class will do. The content ideas for the extensions come from Pinterest, my smartphone camera roll and ideas I get through Twitter. I put those ideas into a grid and try to vary the content in a way that students hit the learning targets in a tic-tac-toe fashion while allowing them to have some choice in the matter related to the final format and presentation audience of their creation.
Here is an example of the grid I compiled today:

From a Google satellite image, this is a skyview of the roundabout at Super Target in Blaine before the bull’s eye was covered in black. Use Google Earth tools to take measurements and decide how much red and white paint must be ordered to repaint it. Write your findings as a letter to Target trying to convince them to bring back the bull’s eye design in their parking lot again.Analyze a piece by Escher or Gonsalves and discuss all the elements present in the piece and how the Geometry leads the viewer to believe the illusion present. Use geometry vocabulary in our book and present your findings in one page, formatted to be hung on the classroom wall. Make sure to cite your source for the image you are including with the artist name and the piece title.Analyze the structure of a spider web in this image as if you were a natural biologist in the field attempting to make a new discovery. Make connections to the Geometry you had learned as a student present in the web and any patterns that you find. Summarize your findings in written form as if you were submitting it to a popular science journal.
Create an art piece to be displayed in our school using concepts of our learning targets in the piece. Include a paragraph description card explaining your piece and the geometric elements present in your art.Use a known distance in this image to calculate the accuracy of this map from a children’s puzzle. Present your findings as if you were quality control for this toy manufacturer. If you decide that it is inaccurate, show where a better placement of the cities should be. Justify your results using math.If I am only interested in re-siding my house without any concern for design appeal, which size plank will bring the lowest cost per square foot? The highest cost? Are these costs affected by the size of my house?
Create a geometric pattern that is to scale that you believe would look nice in a 20 foot by 20 foot patio. Use the block dimensions and prices in this photo. Calculate your cost and then determine how your cost compares to the cheapest and most expensive block arrangement possible. Prepare three boards that you would present to a landscaping client prior to beginning work.Create a visual presentation in a format of your choosing of our learning targets that could be used by a struggling student to help better understand the ideas in our unit. You may include videos, photos or diagrams that you think are helpful.  Make sure that all learning targets are addressed.Conduct a geometric photo scavenger hunt. Create a blog post of your favorite 10 photos to be shared with our class with explanations of both why you chose each photo to be included and what geometry elements are present in each photo.

Monday, July 16, 2012

Quadratic video investigation

I'm experimenting with some new tools I've acquired this summer. Camtasia 8 for video production, Tracker for analyzing motion in a video and also contemplating embedding shortened url's at the end of the video pointing to data for student investigation.

I'm not all that defined at this point in the lesson but I'm hoping to tie in quadratic equations, reflections and some introductory physics ideas. I'm hoping students will think the return path of the ball is the same as the path leading up to it and the progressive analysis in the video will challenge them to investigate what happened to cause the ball to follow a different path after the bounce. Some possible follow up experiments for the students their own video analysis and varying the experiment a bit--what happens when the ball is on its way up or down at the bounce? What if it hits the ceiling and then the wall? What if the ball is more bouncy?
My plan is to use this lesson with Algebra, Geometry and Algebra 2 students. I'd love comments or suggestions as to where to go with this.