We are in a two week period where they are taking a final in any one of their given classes every day because it is the end of the trimester and that is what we do here.
6 weeks (2 weeks x 3 trimesters)
We have state tests coming up in a month, which, for our 8th graders means that they will have one week in a computer lab for each subject area (math, language arts and science)
3 weeks
Our 8th graders have already taken the 8th grade version of the ACT, the EXPLORE test over two class periods, mandated by the state.
2 days
We do two weeks of school district computerized testing in the fall to...gather data for math and language arts.
2 weeks
Plus the regular assessments for grade that classroom teachers give students on a weekly or bi-weekly basis.
3.5-7 weeks (5 days a week for 36 weeks in a school year)
For a grand total of 18 weeks out of 36 in a school year where my kids are taking a test. Kids. Tests. Tests....kids.
50% of the school year
So we needed a reminder today about what learning and being a kid looks like and feels like: Puppies and Stairs. It was fun to be able to watch the kids laugh and relate to the dogs learning to do something as basic as going up or down stairs and I could see it in their eyes that they understood that this is what learning really is. Sometimes we fall down and often something that feels difficult at first becomes automatic later. The struggle is important (and fun to reflect on) and because of the struggle the learning can have more meaning to us if we persist and don't give up.
I needed this reminder today too. These are still kids in front of me. They still need time with their families. They have feelings. They, like me, like watching videos sometimes about puppies learning to use stairs.
What is important? What message do I want to convey?
A year back I found myself presenting on some assessment tools I've made. As I looked at the room full of people I thought to myself,
"Is this who I am? Have I become the guy that's excited about testing tools?!"
I wanted the answer to be "No!" but my presentation topic and blog posts would probably say otherwise.
From that day on I have decided two things:
1) I'm really tired of presenting on assessment technology at conferences
2) I want to invest more time in content development and not content assessment for my students
In recognizing that I've been writing a lot less this year, I've decided I need to update The Internet on what I'm really about. I could either say what I'm about or I could give some examples of what I'm trying to do so here we go...
Meyer-ish activities
The more I follow and read stuff from Dan Meyer, the more I'm influenced as a math teacher. I find myself going to YouTube and looking for ideas, capturing way more math with my iPhone (there should be an educator tax credit for math teachers that have iPhones) and scouring Pinterest for the perfect picture for our next activity.
A recent one I've found is this video where these guys flood a bathroom in a house. The video is actually two years old which on YouTube is like an antique.
I have embedded it into a presentation and plan to use it today to introduce our volume unit. In one picture I layered a before and after image to actually help in finding the final height of the water before it crashes through the floor. On the last slide is a linked student handout.
What I love is that I was able to pull out some realistic answers based on some reference points in the video itself and with the ideas of bathrooms, flooding and ultimate destruction of a house I'm thinking it will be a hit with the 8th graders.
Extension projects for students
I've been continuing on with the idea of developing new ideas in class first with my students. As often as possible we are using physical tools, drawings, constructions and media to scaffold our learning. I do not introduce new things to students when they are away from me. When video is used, it is to review or reinforce what has taken place in the classroom. Students are reporting often that our activity in class replaced the need for the video altogether and that's great.
As an option for demonstrating understanding students can complete a unit project that is a deeper application of our learning. I love seeing the student creativity and individual choice as these are being completed. I have one student who has told me that he is now doing them "not because I have to but because they are just fun!". How cool is that? For more on that and an example you can check out this post.
In another example of a project students created a powerpoint based off of a flowchart they made. The flowchart consisted of "Yes" and "No" questions that would identify special quadrilaterals by their properties. In the end of each path, the quadrilateral present in the user's mind should be identified correctly. In transitioning to the powerpoint, students made links for a "Yes" and "No" response to individual slides that would be next in identification of the shape.
What I loved about this project is students are required to think as programmers as they design and test their product to make sure it works without the need at this point to learn any computer code.
Still working on it
I hope that I don't ever come across like I've figured it out. Each year that I teach I feel like I'm starting all over or realizing there is a much better way of doing something in class. What I do find myself thinking more this year is that what we are doing in class seems to jive more with what I hear research is telling us to do--differentiate, provide choice for students, allow the students to develop their understanding, require them to do the reasoning.
I've updated the email results script to allow for teachers to withhold correct answers in the feedback email students receive. By default, when the email results are triggered from the assessment menu, the correct answers will be sent to items missed.
To prevent this from happening you can now go to the Setup and Results tab in the individual test spreadsheet, click in the yellow cell (G2) and select "Don't Send Answers". Students will then receive an email with their score, their submitted answer and your feedback or standard identified with that item.
I finished up what seems to be a working automatic seating chart creator. It is meant to be an add-on for those using my course management system. The idea is that after a given assessment or data point, a seating chart can be made to organize what will be happening in class that day with minimal time spent on creating the chart itself. A teacher could group by higher or lower ability or heterogeneous for peer-to-peer tutoring in a review session.
The new feature is included for those new to downloading my template but for those already using it you'll have to install a script:
From your course management file menu choose "Tools" then "Script Editor".
A new tab will open, in that tab click on the "File" menu, choose "New" and then "Script File"
After doing so, click the "save" icon and then in the "Run" menu, choose "installSeats". You may have to authorize the script and then make the selection again.
You should have a new sheet on your system now titled "Seats".
To make a chart, select a test in the yellow cell and then in the columns to the right type in numbers 1-(max of 60). The 1 represents the lowest score, and as you move up these represent students that performed better on the given assessment. After filling in all values for your largest class size, click the "Create Chart Formula" button--you may have to authorize the script and click it again.
Now when you change classes and units in the dashboard sheet this chart will update based on your selections. If you want multiple arrangements just duplicate the sheet, reset it and do a different configuration.
Thanks to some teachers I've worked with in the past few days we have caught (and fixed) some bugs in the course management system. The bug happened when the two tests selected for comparison were the same (and blank). This was causing some formulas and filtering to be overwritten in places hidden from view. You know this is happening to you if you are not seeing any growth data graphs populating in the dashboard. It is possible that you'll never see this problem if you only select tests from your drop-down menu but for all new templates downloaded from here this should now be fixed. I've also changed the validated list for selecting the class period and am hoping this will make that work more smoothly as well. You can get the new template with these fixes applied here: http://mrschwen.blogspot.com/2012/05/course-management-system.html
Last night I discovered while playing with the url shortener API in Google scripts that once a URL has been shortened using the goo.gl address, if you add ".qr" to the end, it will open up the associated QR code.
With this new discovery this morning I have added it in to my course management system so now when a user creates an assessment not only does it send the form link to a unit table of contents, it will also send an inline QR code as well for students. I see this as being helpful for students accessing the form quickly and for a teacher being able to copy that image and place it directly on a paper copy of the test. The form links are now also paragraph items rather than list items which I think should help if the user wants to edit the text later. For users of the course management system this update is applied for all future units created.
Listen to how nerdy I've become...
As I've accepted that the data entity I work with is now uniform and ever evolving it seems new ideas come up on a regular basis of how I can use it to inform instruction with the individual students in front of me in the classroom. The latest development has been the mastery grade book page.
Students initially take a pretest on the unit, becoming their current mastery level snapshot. As students begin the course work they submit future snapshots of their learning that replace the pretest score. I can choose what assignments to include or exclude at any given time as part of the grade percentage and any that are coded as 'Retake' replace the score that preceded it automatically in the calculation. I also have score column that reports an overall percentage of the work a student has completed that is independent of the exclude/include category.
If using the 'Final' category for an assessment, the 'Include' assignments work more as formative assessments where their scores are replaced after completion of a 'Final' (summative) unit assessment (In this scenario, a Retake following a Final would not replace the score however).
What this doesn't capture and what I can assure you is still happening in my classroom is higher level collaboration, problem-based learning and rich math discussions. This is simply a tool to give me another outside look at some of the data related to my students' learning.
Click here to get started with directions and relevant links. Click here to get Alex Vanyo's AppleScript App that allows for copying and pasting into a web-based grade book as seen in the video. You can also access a PC Java version on his newly launched website piquy.net. He's also shared some other projects he's completed on the site as well. My favorite is the programming he used to create a Google Map region and identify a location based on an entered address.
I'll share some quick data that has been encouraging in a time that has also been stressful with the end of the year approaching...
We (myself and two other teachers) had a quiz that students took last week that didn't go so well. In the past we've required students to have mastered the learning targets before taking the test (best practice) but with state testing, finals and the end of the year approaching all students took the test on the same day (reality). The results were interesting. On the homework quizzes students had 61%, 71% and 40% on the learning targets (including students that have done corrections). The learning targets on the test came through at 65%, 71% and 43% respectively. I talked with my classes yesterday and it was helpful in demonstrating why I have them do reflections and corrections on their misunderstandings in our learning cycle.
I also looked at some data from our previous unit and thought I'd also share this graphic showing growth across the pretest, test and retake (for those students that retested):
First of all, there really isn't a chance that the script I've put together is 'dangerous' but the title is at least catchy if you're reading this. I've benefitted a lot from the MCQ and Remove Duplicates scripts created by Romain Vialard in the Google Apps Script gallery. I have always had them included in the templates I've shared but I have now put them together in one script and added a menu function that should load when you download the newest templates. (Click here for the script if you want to install it yourself on a template you already have.) I know very little about scripts and programming but was pretty good at piecing together html in the late 90's so this felt pretty similar to that.
The menu will allow you to clear all past student submissions, remove duplicate entries in one click, get the form url and also get the spreadsheet key if you're using one of my shared dashboards. I have the "Clear All Responses" option at the bottom because that wouldn't be good to accidentally click that one. I'm excited about having an integrated menu and hope that it adds some user-friendliness to the whole process.
If anyone knows how to set a trigger (see more here) from the menu or change this script so that a trigger is automatically set to run the 'sendemailonformsubmit' function that would be a huge help for many uncomfortable with setting a trigger. I'm not even sure if it's possible at this point.
If you're interested in collaborating on this it'd be really cool to have the email reports look more like the individual student results tab in the spreadsheet when they're sent out but that goes beyond my skills at this point.
We started a new unit this past week and I have resolved to implement more differentiated activities with my students. I've been polling students at the beginning of class with a question meant to identify those students I want to work with more intentionally during the period. Those identified students then do some small group instruction with me, group work on the interactive whiteboard, discussions, etc during the class period. A follow up question is done near the end of class for me to quick check in with students still having misconceptions.
I've also begun printing off a handful of practice sheets (nothing fancy, just the provided resources with our text adoption) for the students that just want some extra practice or for the students that I think need an extra challenge beyond the basic material (differentiated tasks during class). I have backed off from the more self-paced approach and focused more on depth than speed in the classroom. Students that finish early I encourage to work on a more challenging task or review past lessons with each other. This has helped to make daily class less crazy and more focused.
Pretest to Quiz Growth Results
I'm pleased with the growth results shown on our quiz today (measured from the pretest to current quiz) as they seem to be much more consistent than past results have been. I feel that individual student needs have been met more intentionally with this approach and look forward to moving more in this direction as the year progresses.
For those already using my google forms assessment template (click here), and using my unit dashboard template (here towards the bottom of the page), this template will allow for a single file to navigate between multiple units to investigate classes and individual students. This could be used as a final piece once a course and all tests have been built. I've been using it the last week or so and it has helped cut down on (some) of the browser tabs I have open and saved time as well.
In conclusion to my Open letter to an edtech company series (here and here) I've launched a website this week that releases my own student response system: WiFli Student Response Sytem (www.wifliresponse.com) The platform is cloud-based and works through Google Forms and Spreadsheets. For access, the system relies on either student owned or classroom sets of computers or other web-enabled devices.
Dashboard View
The cost is considerably less than some of the fees being charged by other edtech companies (less than 1%) and I feel that the data returned is much more useful in directing immediate classroom instruction for individual and groups of students. Another positive in my mind is that it does not rely on a third-party (besides Google anyway) to run and you will own the student data in your own personal Google account.
The results are integrated into a single-view dashboard appearance with data filtering options, student confidence level and overall correct percentages (see image above). Within the dashboard there is a history of 10 questions that can be seen for after class reflection by the teacher. No editing is required by the end-user but there are some options available like integrating a class list to show who has not yet responded--it can also detect which class is submitting answers and unlike other web-based student response systems the teacher has the option to set the correct answer in the question set.
I've priced it at $5 for a single user trying to keep it comparable to an app price. The cost is a one-time fee and only needs to be payed by the teacher, the students will access it by one link shared for an entire school year. School and district pricing options are also available with a little humor in the pricing for edtech companies.
I surveyed my students again after completing another unit of study. I gave the same survey at the beginning of the year with less definite results than what have appeared mid-year in the graph below. I have correlated individual components of my classroom structure with actual student assessment results. Students self-reported their study habits and I asked them to only answer "yes" or "no" to individual questions if it was true 100% of the time in this past unit. It appears the most significant indicators of a successful end of the unit assessment are students that watch every video (0.28 correlation) and students that ask for help in class (0.2 correlation).
There are some positive things to note in the negative correlations as well I believe:
The lower correlation behaviors are all behaviors that would normally be required in a traditional classroom (doing an entire homework assignment, reading the textbook section, taking notes). I see this as students are now able to do what it is they know they learn best with and abandon strategies that simply do not work for their learning style.
Outside of class study time reported by students was also low so I believe the flipclass approach is taking a large burden of time off of my students this year and placing the majority of their learning time inside of the classroom (although I wouldn't mind if they started studying more at home).
Thank you to all my loyal readers. Last February when I started blogging I never would have dreamed I'd be sitting at nearly 18,000 views today. Happy Holidays!
I have been doing some reflecting over the summer. I want to make sure I'm continuing to use Google Forms for an assessment tool because it is the best option for my classroom and not just because I've invested a lot of time into it.
Moodle:
Pro's: Can display data by class, allows randomized questions and item banks, purely electronic
Con's: Time intensive, requires tech-savvy to make it look nice
First on the subject of moodle, my main reason for not liking it is I don't like how it looks and comes across for the end-user. I know there are ways of customizing it to look cleaner and less busy. The trouble is I simply don't have time to simplify the appearance of something when there are simpler appearing products out there. Moodle has some benefits though--if all students have joined a class you can see a gradebook view once they have completed it that will give stats like how long they spent on the assessment. You can randomize questions and pull from an item bank to build multiple versions of an assessment. That said, I tried building an assessment in Moodle this summer and the number of checkboxes and menu options for each assessment item was overwhelming to say the least. It was too time intensive. I realize there are shared item banks out there and once the work is done, it's done but I already have working tests that have gone through revision processes and I am not interested in starting from scratch or in importing the test items into moodle.
Commercial Product:
Pro's: Allows for scores by learning target, easy to compare data with other teachers in collaboration
Con's: Difficult method for individualized learning plans, still uses paper for the most part, not able to do short answer which is nice for math solutions.
Currently in our district we have a product that gathers student test data. The main collection process is by printing bubble sheets and then later scanning them in (nothing really all that new to education). The test items can be scored by learning target as long as the targets are a state or national standard already preloaded into the system. I'm told there will be an online component as well that would let students enter the assessment through classroom clickers or a website. It seems it would be difficult to use this option if students were not all in the same place at the same time (something I'm trying to move away from in a more individual learner approach). I don't like the idea of students needing to wait until the next day to get their results, and moreover needing to print yet another sheet of paper that would give them their results. On a positive note, this product would allow me to use my current course tests although most answers submitted would need to be fixed choice of some kind (T/F, multiple choice, gridded-response).
Google Forms
Pro's: It's Google, simple appearance to end-user, easy to link to externally, template created saves time on item customization, works well for individualized classroom pacing, graphs and visual data displayed for teacher quickly to assess class/individual data, scores by teacher custom learning targets, ability to collect and correct text/short answer items.
Con's: To customize the reports beyond the template some knowledge of spreadsheet formulas is necessary, initial setup is quick but can be confusing for a first time user
In using Google Forms, I have been able to move to a more self-paced classroom. I have worked with smaller gifted math classroom formats where that was the common practice but this has allowed me to adapt those same instructional strategies for my larger (30+) classes. Students now move on at their own pace after demonstrating mastery. The student knows, without my need to tell them, an estimate of their understanding by the automatic feedback upon completing an assessment (also possible in Moodle). As a math teacher it is also nice to have the option to request numerical answers from students (rounded if necessary to a specific place value)--this is also possible in Moodle I believe. I get quick snapshots of students and classes simply by opening an assessment and these graphs can also be easily displayed on a class website for the public. The assessments are embedded in Google Docs along with links to the electronic text and instructional videos. It was important for me that these were all in the same place for my students.
After reflecting on these three options, I have decided to continue on in using Google Forms as a tool in the classroom. The decision can mostly be the attributed to the ease of implementation in a learner-centered classroom, that I had the option to really customize it to gather and report the type of information that was relevant to me as a teacher and to be able to access it in a quick, visual manner.
As an update, I am no longer using this style of teaching in my classroom but will leave this post up as an archive of where I have been in my journey as a classroom teacher. After thanking my students for letting me “experiment” with some new instructional strategies, I allowed them to give me some feedback on the tools we used as a class throughout the school year. Students remained anonymous unless they chose to enter their name at the end of the survey. I asked them to be honest so that I can continue, modify or change things to improve for the classes next year. The survey, like many things in class, was completed on iPods through a Google Form so that I could share the results with them as they were coming in. Below are some of the findings.
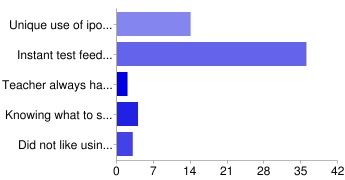
During the last half of the year, students submitted test responses through Google Forms on iPods. (Get my template here) Our district has a paper bubble sheet form that can be used alongside a computer so I wanted to hear from the students on what they liked best about the iPod method (the paper bubble sheets do not give students instant feedback...)
Unique use of ipods in math
14
24%
Instant test feedback
36
61%
Teacher always has an electronic result if I lose the paper copy
2
3%
Knowing what to section(s) to retake as soon as the test is finished
4
7%
Did not like using the ipods for tests
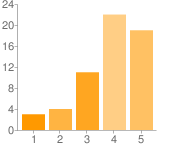
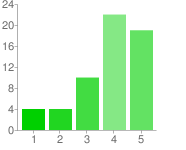
When asked how well they liked the self-paced, individualized format compared to a traditional large group instructional format, here is how they responded:
(5 was strong like, 1 was strong dislike)
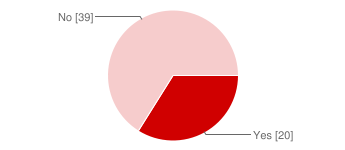
In planning for next year, I wanted to know if any students would have preferred to have the videos on DVD instead of delivered through the Internet. I was surprised to find ⅓ would have liked them on DVD. This is a good workaround for the students that have difficulty accessing a computer or Internet at home since I think a much higher number of students will have a DVD player.
(Students answering “yes” are saying they would prefer the videos on DVD rather than online or portable devices)
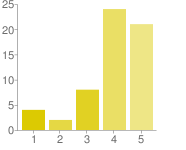
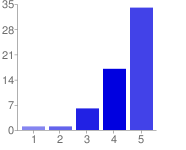
I required all students to submit select answers (covering the basic ideas for each learning topic) through a Google Form to be automatically corrected. Students get the answers right away after submission. I asked students “How helpful was the homework quiz process in knowing what you understand and do not understand?”
(1 was “not helpful”, 5 represents “very helpful”)
After submitting a homework quiz, students have the opportunity to correct their mistakes and work toward the correct answer. These corrections can be turned in the next day for additional credit. The graphic below is a reflection of their perception of this process (1 meaning the process was not helpful and 5 meaning the process was very helpful). (See the correction form students hand in here)
I wanted to get an idea of how accurate their grade was at the end of the trimester compared to their perception of their own understanding, again 1 would represent “not accurate” and 5 would be “very accurate”.
Additional student comments from the survey:
"I liked the layout and being more of a "technology" class"
(Some teachers) "Make people turn in paper homework just to make sure they did it (thankyou for not doing that to us)"
"I really enjoyed the class even though it was challenging."
"This class was very unique and very well done. I defiantly think that it helped my learning. "
"I love how everything was accessible at home from the computer, that was super helpful !"
"Math was challenging this year but being able to retake really helped me and I think the sections I retook I knew it better. "
I realize some elements to this blog could be classified as a concept car--cool but will never make it to mass production. I have taken that into consideration and tried to come up with a tool that can be used by at least the technologically savvy educators. And hopefully someday that will be all of us. My hope though, if nothing else, is to push us beyond what we've been taught to do as teachers: correct by hand, analyze our students by vague observations and be surprised by test scores every other week.
When I was in high school I really liked the idea of putting forms on websites. What I didn't like was the jumbled up email message you'd get every time someone submitted the form. Google has changed all of that and many of you may already know this. One of their products, Forms, allows a person to post a form online. The form gathers information and then organizes it into a spreadsheet. Spreadsheets can use formulas. Formulas can do work. We can sit back and view the data.
My first form with formulas took a long time to set up. I thought, "I can't do this on a regular basis. I don't have the time." But then I took that form and recreated it to be a template that I could just copy and reuse for each quiz or assessment I wanted to make. The formulas gather student entries, score them and then give me scores by class. I also get a graph by item number to know which questions we need to revisit the next day in class.
I have been doing this process all year and love not having to hand-grade assignments any longer. I also appreciate knowing which questions we need to go over in class before the students are even in front of me. The level of student accountability is unprecedented as well. Students are now receiving scores on homework and are not able to move on until they demonstrate an understanding of those skills. No one takes a test until those skills are mastered. Differentiation is finally becoming a classroom reality. (Original template is available in Google Docs Template Gallery by searching "andyschwen").
I've upgraded my template this past week and am excited about the wealth of information it will bring. My collaborative team and I separate our test scores into categories. Students are able to retake individual sections of the test once they demonstrate additional learning and complete review activities. The new template will give me scores for each standard (by all students, by class and individual students). I get a dashboard graph back for each student that shows their overall score and each standard score. A visual, quick representation of their test performance. This is instant, with no data entry on my part. Get the updated templates here.
I'm trying this out for the first time with a test this week. Students will have ipod touches and a paper copy of the test. Once the test is completed they will submit their answers. I will not have to stay after school for 3 hours grading tests and they will know immediately upon completing the test which questions they got wrong. I will not need to print any scan sheets on paper or spend time feeding them into a machine. I can pull up multiple graphs to assess individual student needs or what areas I need to refocus my instruction on.
I realize there are products out there that do similar things. But they cost money. They are not customizable for our needs in the classroom and they may only work with a specific textbook or website. My dream would be that I would have a class set of iPad or XOOM Each test would have a QR code on it and students could scan the code on the test to go directly to the submission form.
Potentially then students could work at their own pace when benchmarks have been completed they can move on. All the tests are ready because they are out there on the cloud. I don't have to fish out any answer keys from a binder because they're corrected as soon as the student is finished.
If you are a school already using Google products and sound interested in implementing some of these things I'd be happy to come work with a group in getting started.




 or
or 